Case study
CompanyGraph
The tension
Every stock tool sells narrative. "This stock is heading up because momentum is building." The narrative is the product. When the narrative fails, the user blames the tool, then blames themselves. Most teams find it impossible to resist the gravity of predictive language because predictive language is what drives traffic.
CompanyGraph is built so that resistance is structural, not aspirational.
Why the naive solution fails
Compute a score. Wrap it in outcome language ("buy signal", "bullish divergence", "momentum building"). Trust the narrative to do the engagement work. The cost is hidden until users start internalizing the narrative as causal advice — and the system has no way to take it back.
The deeper problem is that this approach blurs the boundary between measurement and interpretation. Once they are mixed, the system can no longer tell you what it actually knows from what it inferred.
The design rule
Observations describe what IS. Interpretations emerge when independent observations align across epistemic categories. No prediction. No advice. No buy/sell language. Ever.
This rule propagates from the observation interfaces, through the interpretation resolver, into the AI prompt config, into the public copy. It is enforced in code, not just in style guides.
What was actually built
The rule lives in real types.
Abstractions/ObservationEngine/IInterpretationType.cs — the contract every interpretation implements. The Dynamics field literally forbids predictive language: "Do NOT predict outcomes or future events. Do NOT include advice, narrative framing, or interpretation."
ObservationTypeBase.ValidateContext() — gates computation. When preconditions aren't met, the observation returns null. It does not emit a fake score to keep the UI looking complete.
InterpretationResolver.Resolve() — matches observations by structural alignment, not by predictive forecasting. Interpretations combine observations across epistemic categories — Geometrical, Dynamic, Structural, Temporal, Fundamental — never within. Combining two geometrical observations amplifies conviction without adding knowledge. Combining geometrical + fundamental creates genuine insight.
AIContent/Prompts/CyberneticPromptConfig.cs — line 24: "Describe structure and operations. No predictions, advice, marketing language, or performance judgments." The same rule, encoded in the AI layer. The prompt cannot ask the model to forecast, because the prompt itself is constrained.
The rest is what it takes to run that rule at scale: hundreds of observation specifications, 270+ interpretation types, 190+ REST endpoints, 35 batch executors processing ~104,000 stocks across global exchanges, .NET 9 backend, Next.js public site, React admin dashboard, Hetzner native deploy with webhook auto-deploy.
Architecture
A strict layered backend. Each layer has one responsibility, and responsibilities do not leak between layers.
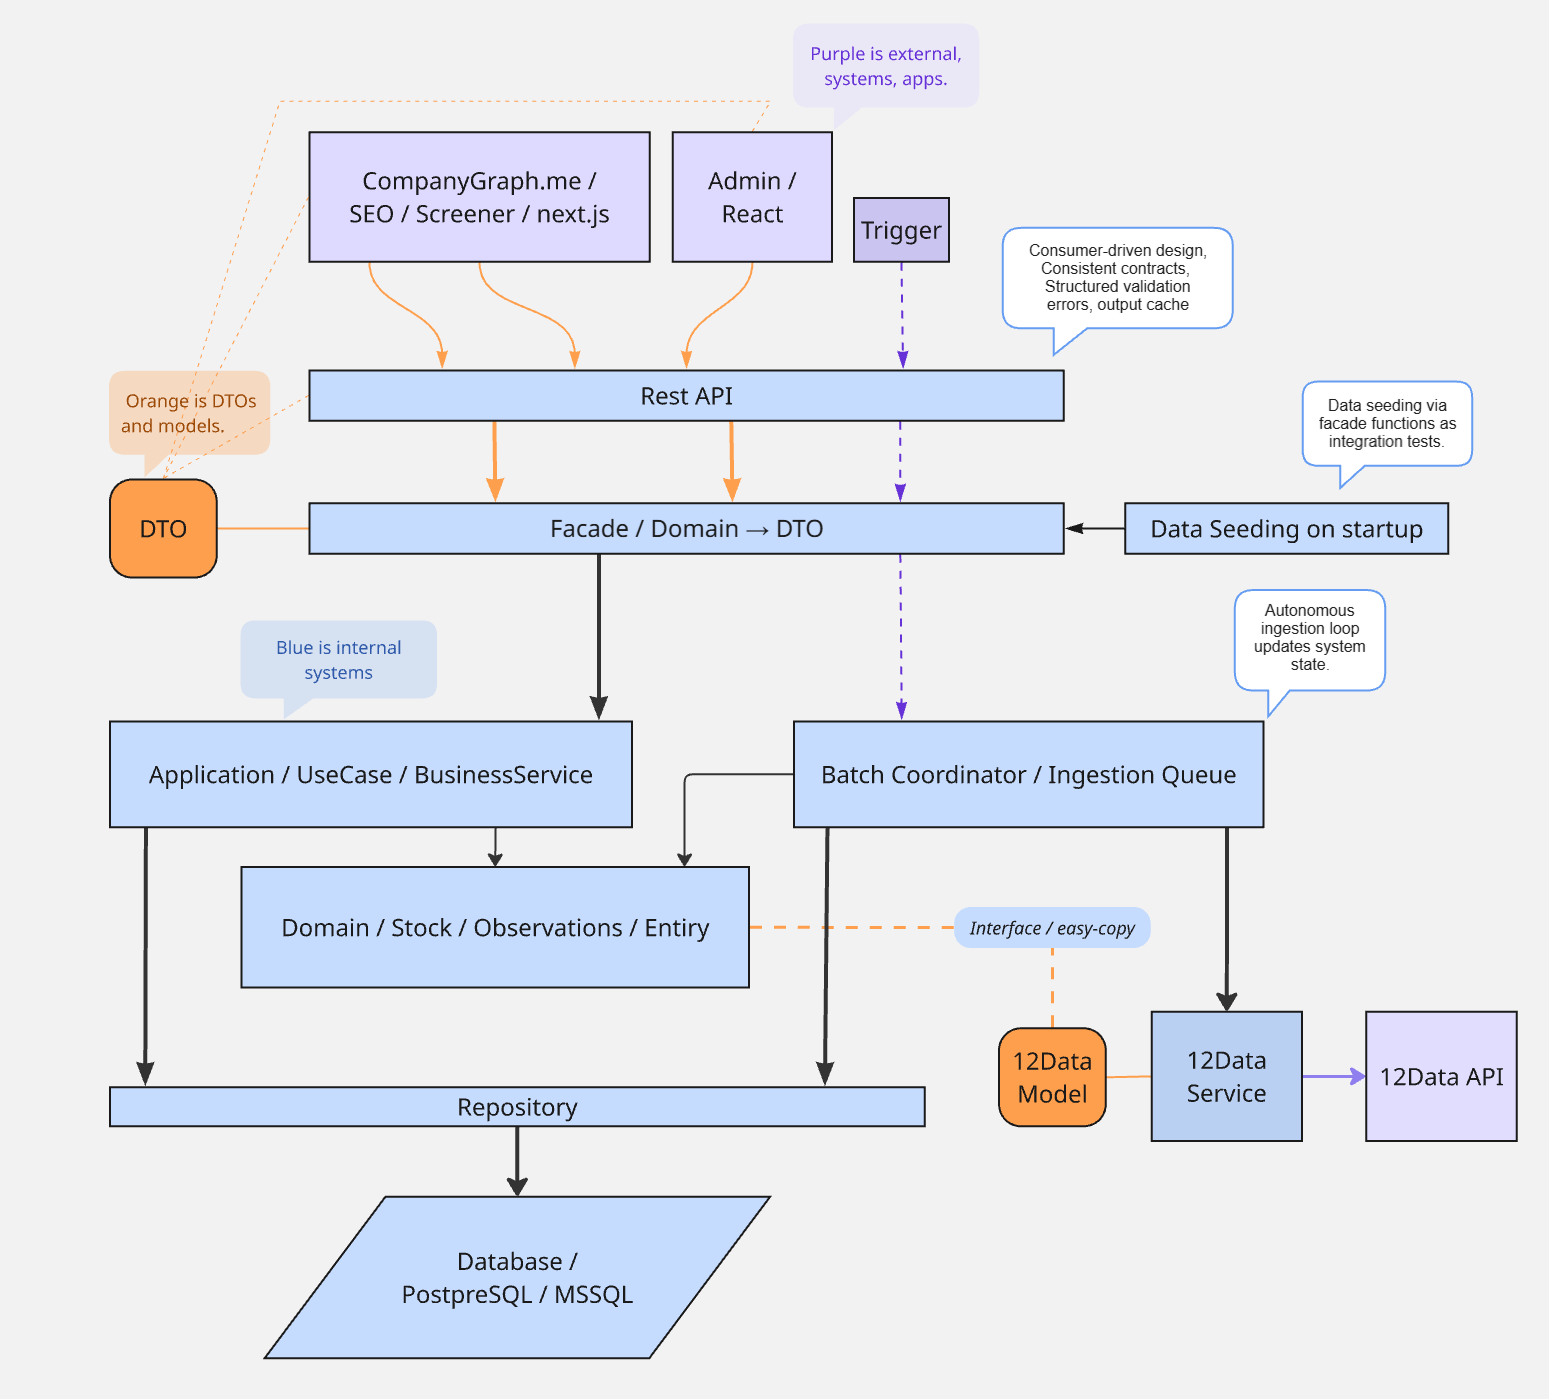
When something goes wrong, there is exactly one place to look. Data access problems → Repositories. Business logic problems → BusinessServices. Request/response problems → Facade. HTTP problems → Controllers. The rule that "no predictions" is enforced in the same way: at the type that defines what an observation or interpretation can say.
Where this discipline holds and where it currently leaks is documented openly — see Code discipline for a worked example on this codebase: a rule kept, the same rule broken on a live endpoint, and the pre-commit gate that catches two of three rules but not the third.
Evidence on the surface
The screener exposes the typed observations and interpretations as filterable pills — structured measurements made navigable.
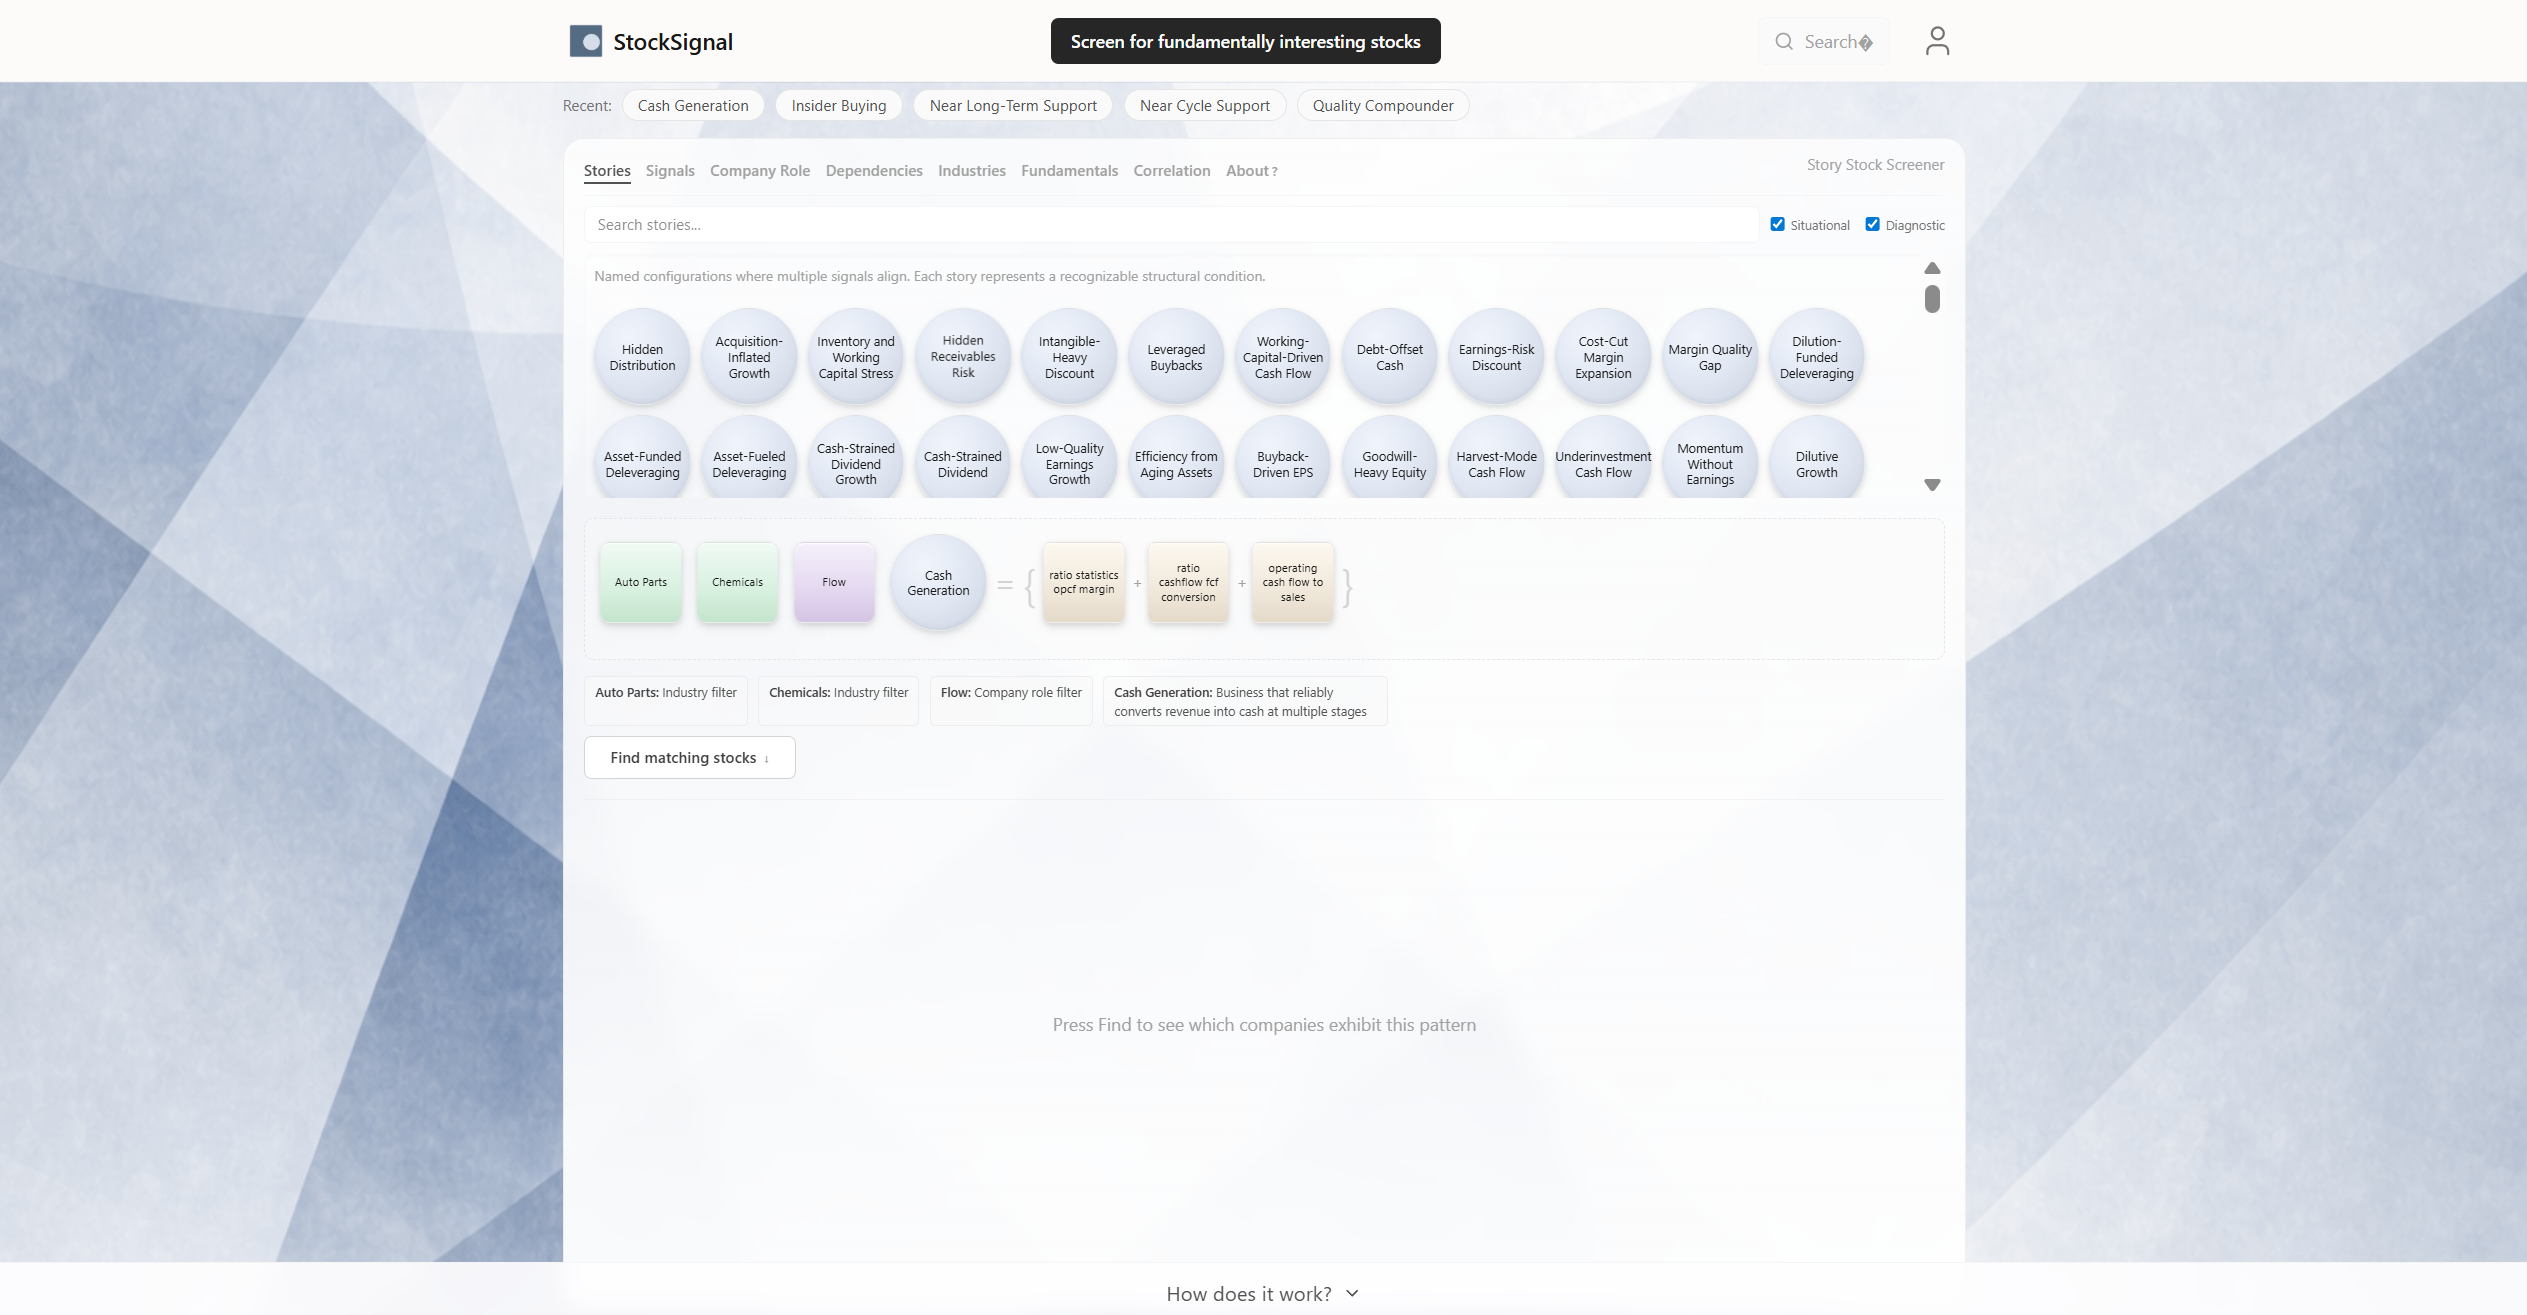
There is no "buy" filter. There is no "going up" filter. Users filter by structural categories: Late Cycle, Cash Cow, Quality Compounder, Dividend Fortress. Each one is the surface of an interpretation type that fired only because multiple independent observations aligned across categories.
The claims are audited against the source
Describing "what is" only counts if the descriptions are true. So the observations are triaged by hand against the real chart and the real fundamentals — Match, Unsure, or Mismatch, ten verdicts per observation — and every verdict is recorded.
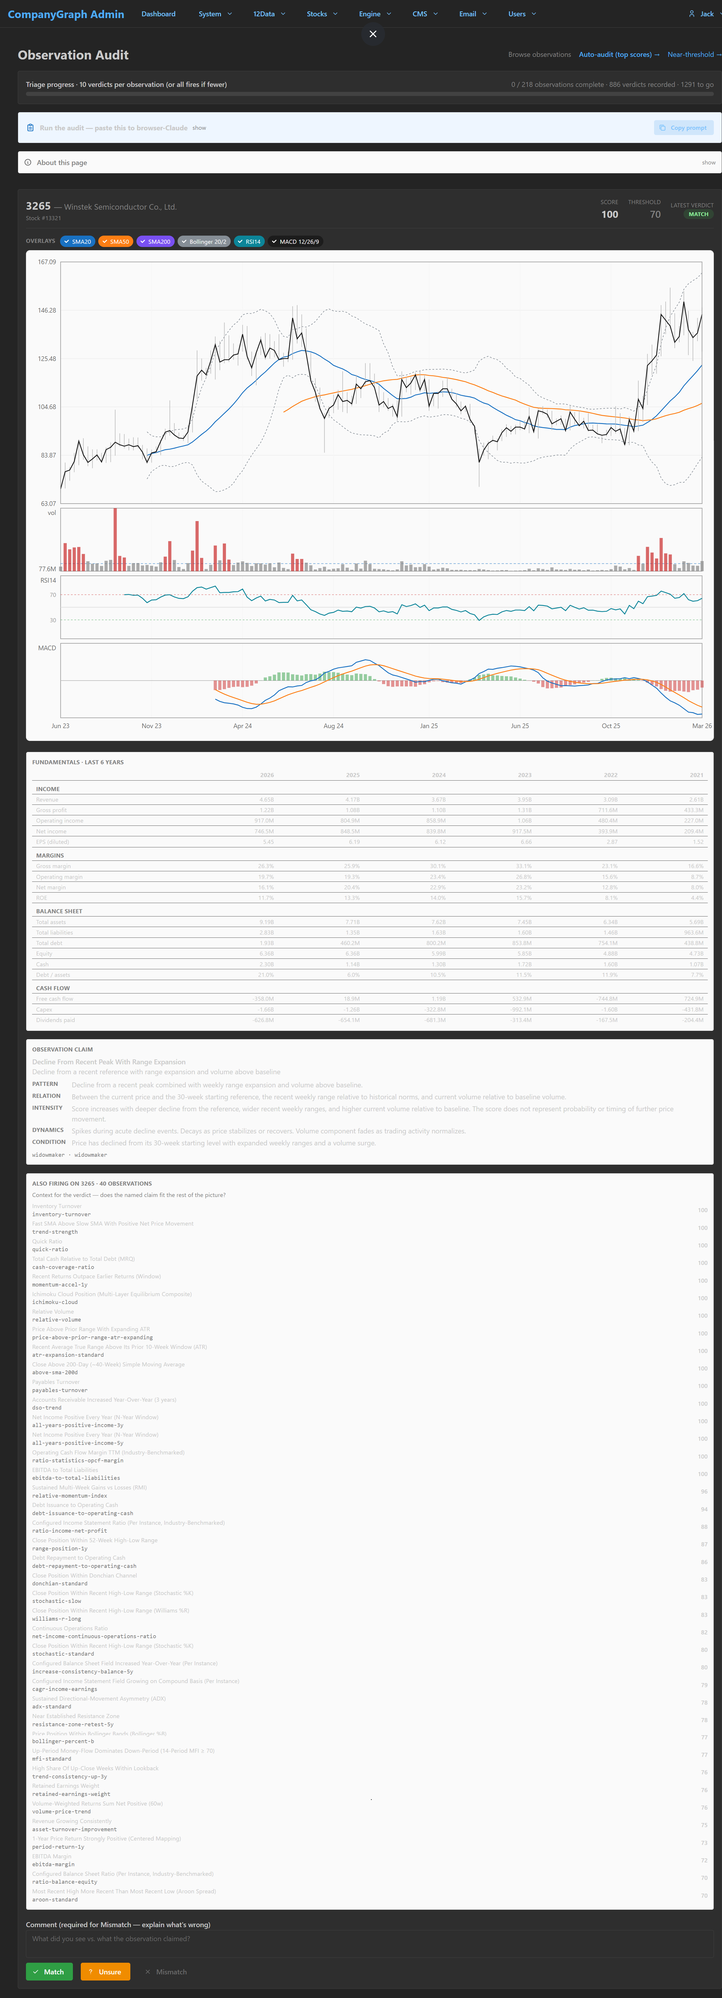
One screen carries everything a verdict needs: the price action with its overlays, six years of fundamentals, the firing observation's claim broken into Pattern, Relation, Intensity, Dynamics, and Condition — and every other observation firing on the same stock, each with its score. The reviewer sees exactly what the system claims next to exactly what the data shows. The riskiest claims go first: the ones the system scores highest, and the ones sitting right on the firing threshold, where a small error flips a call on or off. The rule — describe what is, never predict — isn't trusted to hold. It is checked, observation by observation, against the source it came from, not against its own score.
Patterns that hold this together
CompanyGraph is the proof that the patterns hold at scale. Each one has its own case study:
- The vendor integration is bounded and observable — see TwelveData integration boundary.
- Background work has lifecycle and visibility — see Batch service & lifecycle visibility.
- AI is used to enrich typed fields, not to write prose — see Structured Data → Knowledge Surfaces.
What this proves Smallbox can do
Build full systems end-to-end where one architectural rule holds from the database all the way to the public copy — and where that rule is the product. Pragmatic decisions, explicit trade-offs, end-to-end ownership: database schema, API design, frontend rendering, AI content generation, deployment automation, production monitoring.
Want your product in this shape?